Engineering insights on monitoring, reliability, and developer tooling.
Architecture, storage backends, OTel integration, and a decision table. An honest technical comparison with no marketing spin for either side.
Agents loop, call tools, and accumulate costs autonomously. Four pillars of observability that keep them in bounds, with OTel instrumentation examples.
Spans, traces, context propagation, and the OTel convergence. A decision tree for picking your tracing backend and one working pipeline.
We run an AI agent that triages alerts, opens tickets, and investigates incidents autonomously. Here is what works, what doesn't, and what it costs.
Traditional APM doesn't cover LLM apps. Five signals to track, the OpenTelemetry GenAI conventions, and an honest tool comparison.
Monitoring tells you something is broken. Logging tells you why. Here is where one stops and the other starts, and the architecture that connects them.
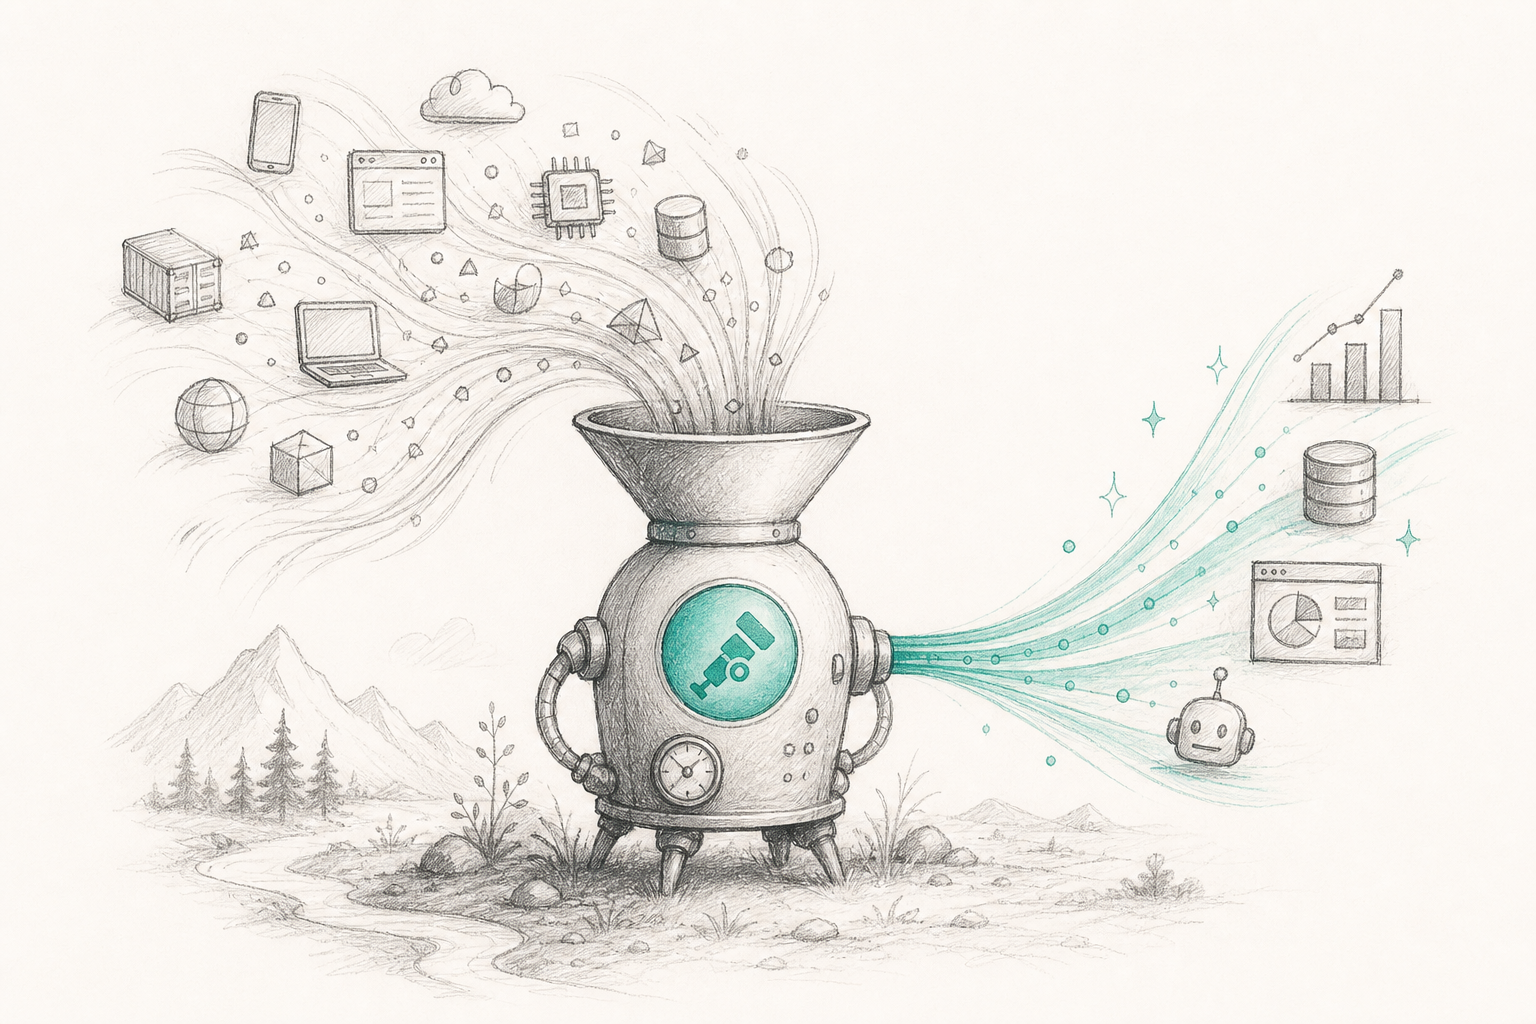
The OTel Collector sits between your SDKs and your backends. A decision tree, the receiver-processor-exporter pipeline, and one working YAML.
Jaeger captures the full request path across microservices. The architecture, a working setup with OpenTelemetry, and when tracing complements monitoring.
MTTA, MTTR, MTBF, and MTTF each measure a different phase of the incident lifecycle. Where each one starts, stops, and what it tells you.
MTBF measures how long a system runs between failures. The formula, a worked example, and when MTBF tells you more than uptime percentage.
A practical sev1-through-sev4 guide with the triage matrix, the severity-vs-priority distinction, and the routing rules that make the scale stick.
SLIs measure, SLOs set the target, SLAs make it contractual. How to choose the right SLI, set a realistic SLO, and spend your error budget.
Runbooks are the procedure you want during an incident, not the wiki nobody reads. Anatomy, a worked example, and how to write ones AI agents can execute.
MTTR — Mean Time To Recovery, Repair, Respond, or Resolve? What each measures, how to calculate it, and the six changes that actually move the number.
Diagnose and fix slow DNS resolution, DNS_PROBE_FINISHED_NXDOMAIN, and DNS server not responding errors with real commands and output.
An SSL error means the TLS handshake failed. Learn how to decode the error, fix it, and monitor certificates so it never surprises you again.
Uptime monitoring, dependency intelligence, status pages, and a full developer surface — built for the way software is operated today.
The era of monitoring tools built for human engineers is over. SRE is undergoing a profound shift, and the infrastructure needs to catch up.